
Tech & Gear · Tutorial
How to Read the National Weather Service Hourly Forecast
Use the National Weather Service hourly graph to see when temperatures, wind and precipitation chances may change.
 By Tony Simons 3 min read
Disclosure: We may earn a commission when you shop through the links below. It never changes the verdict. Details
Disclosure
We may earn a commission when you shop through the links below. Opinions stay independent. Full disclosure
Planning an outdoor project or trying to pick a better time for a walk? The National Weather Service’s hourly graph can show how the forecast changes through the day instead of leaving you with one high, one low and a tiny cloud icon.
Quick answer: Go to weather.gov, search for a U.S. city and state or ZIP code, and open Hourly Weather Forecast on the local forecast page. Choose the elements and time period you want, then read the graph’s dates, hours, legend and scale.
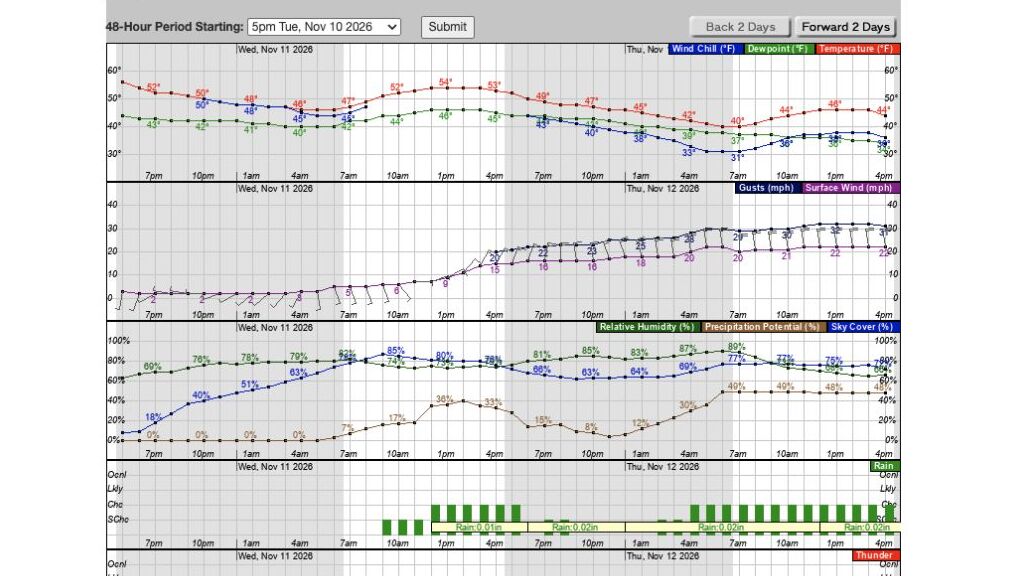
We searched for Chicago and opened its hourly graph. The screenshot is a historical example, not a current forecast. Forecasts change; check the latest forecast and official alerts for your actual location before making plans.
1. Find the point forecast
- On weather.gov, enter a city and state or ZIP code in the local forecast search and submit it.
- Check the location named above the extended forecast. If it’s not the place you mean, refine the search or select the appropriate location on the map.
- Find Hourly Weather Forecast under More Information or Additional Forecasts and Information. Select it to open the graph.
The current conditions on the forecast page can come from a nearby observing station. Look at the station name and update time as well as the forecast location; they don’t necessarily describe the exact same spot.
2. Choose what to display
The graph page has checkboxes for elements such as temperature, surface wind, sky cover and precipitation potential. Uncheck elements you don’t need to make the display easier to read. Use the 48-hour period selector and the two-day navigation controls to view another part of the forecast. The NWS hourly graph tutorial explains the controls and says hourly forecasts can extend up to seven days ahead.
3. Read the timing and the scale
Dates appear above the graph and times along its horizontal axis. Read each colored line against its own panel’s legend and vertical scale: temperature is in degrees, surface wind is shown in the selected speed unit, and precipitation potential uses a percentage scale. Don’t read a wind value from the temperature axis.
Precipitation probability is a forecast probability of measurable precipitation at a point during a specified period; it isn’t a promise that it will rain for that percentage of the day. The NWS explains the definition and its limitations in its precipitation-probability guide. Read the graph’s indicated time and check the detailed forecast for context.
On a desktop, the NWS says moving the pointer over the graph reveals a text readout for a selected time below it. If the graph is hard to use on a smaller screen, return to the local forecast and look for Tabular Forecast or the detailed text forecast. We did not test the graph on a phone.
Keep the forecast in context
The graph is a forecast, not a guarantee. Conditions and timing can change, especially farther out. Refresh the official forecast before heading out and review any active watches, warnings or advisories for your location. Have a reliable way to receive urgent alerts; a graph you looked at earlier won’t notify you when conditions change.
How we checked: We searched the NWS website for Chicago and opened its point forecast and hourly graph. We inspected the graph and its controls, but didn’t verify future weather or test every option. Interface and forecast data: National Weather Service; screenshot captured and cropped by TRT.
The Inner Circle
Know what is worth buying before you buy it.
Gear I lived with, guides that save you an afternoon, one email a week.
- New verdicts and scores
- Same-day workflow tips
- No spam, unsubscribe anytime
Written by
Tony Simons
Tony has a bachelor's degree from the University of Phoenix and over 14 years of writing experience between multiple publications in the tech, photography, lifestyle, and deal industries.


